






2025 Energy Reality Check for Indian Manufacturers

In 2025, energy went from a “cost line item” to a board-level cost optimization issue for manufacturers, especially for energy cost sensitive verticals (cement, steel, textile etc) in India. Three patterns stood out: Grid prices stayed uncomfortable, renewables and contracts became more strategic, and AI quietly moved from pilots into operations.

1. Is Energy cheaper than 2022? Definitely not for “All”.

For Indian manufacturers, 2025 didn’t feel like a relief year; it felt like a new normal.

  • The IEA’s mid-year update notes that India’s wholesale electricity prices fell ~15% year-on-year in H1 2025 to about INR 4500/MWh, but still remained above pre-2022 levels. Overall rate drops due to increase in Renewable inclusion, however benefit is available to only those who are using renewable more than 50% in their energy mix in real time. For all others the prices are between INR 8000 to 9000 / MWh. to increase in contribution of Renewables from 29% to 46% since 2015 in total energy mix.
  • At the same time, India’s latest consumption data shows that industry accounts for ~41% of national electricity use, underscoring how exposed manufacturers remain to tariff and market movements with more threats to those who are dependent only on Grid.
  • In some states, effective high-voltage industrial tariffs (including charges and duties) are now in the ₹10–11+/kWh range; for example, Chhattisgarh’s regulator reports a weighted average HV tariff of ₹11.50/kWh for FY 2024-25.

On top of this, India’s short-term power market is maturing fast. Analysis of exchange data shows the short-term market reached ~15.2% of total supply in FY 2025, with ~144 BU traded and ~26% CAGR in volumes since 2009 – alongside a documented rise in price volatility as renewables scale. Organizations with predictable one week forecast can use this effectively.

Implication for CXOs: Budgeting for 2026 cannot assume “mean reversion” to the pre-crisis world. Energy cost is now structurally more volatile and more market – linked.

2. Renewables and PPAs shifted from “good to have” to “risk management”

On the supply side, 2024–25 was the moment within which clean power became the default marginal capacity.

  • Globally, renewable power capacity grew by about 585 GW in 2024, making up ~92.5% of all new power capacity, and pushing renewables’ share of installed capacity to ~46%.
  • In India, the Ministry of New and Renewable Energy and CEA report over 212 GW of renewable capacity out of ~ 466 GW total installed capacity as of January 2025 ,  roughly 45% of the grid.
  • Private demand is reinforcing this trend. Bloomberg NEF data shows global corporate clean-power PPAs hit a record 46 GW in 2023, up 12% year-on-year, representing nearly 10% of global capacity additions once you include only solar and wind.

Within India, analysts now describe open access green power and ToD tariffs as central to how commercial and industrial users stay competitive in a reforming market. CEEW

Implication for CXOs: In 2026, the core question isn’t “Should we buy green power?” It’s how much of your load should be locked in via PPAs vs left flexible on exchanges, and how that mix interacts with your capacity expansions, EVs and data-center plans.

3. Efficiency and PAT proved that “small percentage gains” are big money

India’s long-running Perform, Achieve and Trade (PAT) scheme quietly showed how much structured efficiency can deliver:

  • PAT Cycle I achieved 8.67 MTOE of savings, about 30% above its 6.686 MTOE target, cutting roughly 1.25% of India’s total primary energy supply and avoiding around 31 million tonnes of CO₂.
  • Independent assessments indicate participating firms improved baseline energy consumption by around 5%, overshooting the original 4.05% reduction target.

For an energy-intensive plant, a 3–5% reduction in specific energy consumption often pays back capex in months, not years. PAT data, plus multiple firm-level studies, confirmed that structured efficiency programmes consistently generate this order of magnitude. However, at plant level these Energy guzzlers can still improve with real time, meaningful data collection and use of AI driven actionables derived from this data.

Implication for CXOs: In 2026, efficiency is no longer “nice ESG”. It is proven, regulated, and monetisable through schemes like PAT and ESCerts, and should sit alongside PPAs and tariff strategy in your energy plan.

4. AI moved from pilots to the production line, but unevenly

2025 was the year AI in manufacturing energy shifted from talking to doing, even if maturity is patchy.

  • An OECD 2025 survey finds that among AI-using firms, the single most common use case (44%) is process control, automation and production optimisation, including predictive maintenance and real-time scheduling. Another 28% use AI for defect and anomaly detection.
  • The World Economic Forum’s work on AI in manufacturing highlights that factories still struggle with scaling beyond pilots due to fragmented data, legacy OT, and unclear ROI ownership, even as AI is recognised as a key lever to handle supply-chain shocks and energy volatility.

In India, this is colliding with tariff reform, PAT obligations and RE integration: plant managers are increasingly using AI-driven forecasting, dispatch recommendations and anomaly detection to decide when to draw from grid vs captive vs PPA, and where to target energy audits.

Online meaning full data collection is getting access to energy inputs and related outputs from utility equipment as well as processes – enabling tracking KPIs in real time. Increasing interest is seen across manufacturing Industry to track nonelectrical energy inputs, water, gas and the outputs like temperature, flow, pressure etc.

Implication for CXOs: The competitive gap in 2026 will not be “AI vs no AI”; it will be who has codified their plant-level energy logic into repeatable AI workflows across sites, versus who is still running Excel plus intuition.

5. Regulation made energy data a board responsibility

Two regulatory threads made 2025 a turning point:

  • In India, BRSR and BRSR Core now require the top 1,000 listed entities to disclose detailed ESG metrics, with the value chain and limited assurance requirements being phased in from FY 2023-24 onwards.
  • Globally, the EU’s Corporate Sustainability Reporting Directive (CSRD) is forcing thousands of manufacturers – including many Indian exporters with EU exposure – to report standardised climate and energy data, even as 2025 proposals look to narrow the scope and adjust thresholds.

Implication for CXOs: By 2026, energy data quality, auditability, traceability, reduction in YOY figures will be as important as the savings themselves. Plants that cannot produce defensible, meter-level data will struggle with both compliance and access to green finance.

What this means for your 2026 energy plan

Taken together, 2025 showed that manufacturers who outperformed on energy did three things well:

  1. Treated energy as a portfolio – blending tariffs, markets, PPAs, and on-site assets instead of buying passively.
  2. Embedded efficiency as a continuous programme – PAT-style discipline, not one-off audits.
  3. Operationalised AI on top of solid data – using AI for forecasting, optimisation and anomaly detection where data and controls already exist.

For 2026, the question isn’t “Will energy management be a problem?” It’s whether your organisation will treat it as a controllable, optimisable system, or remain exposed to a market and regulatory environment that has clearly moved on.


References

(All non-consulting, publicly available sources)

  1. Electricity Mid-Year Update 2025 https://www.iea.org/reports/electricity-mid-year-update-2025
  2. MINISTRY OF NEW AND RENEWABLE ENERGY https://mnre.gov.in/en/physical-progress/
  3. BUREAU OF ENERGY EFFICIENCY, Government of India, Ministry of Power https://beeindia.gov.in/perform-achieve-and-trade-pat.php
  4. BRSR Core – Framework for assurance and ESG disclosures for value chain https://www.sebi.gov.in/legal/circulars/jul-2023/brsr-core-framework-for-assurance-and-esg-disclosures-for-value-chain_73854.html
The Energy Opportunity Gap: Why Energy Deserves a Seat in the Boardroom Energy as a Strategic Lever, Not a Utility Bill

Energy is no longer just a resource that fuels machines; it fuels enterprise value.
Every ton produced, every batch completed, and every emission reported has energy at its core.
In manufacturing, energy determines operating margins, cost efficiency, ESG performance, and long-term resilience.

According to the International Energy Agency (IEA), the industrial sector accounts for approximately 37% of global final energy use and around 24% of energy-related CO₂ emissions, highlighting how fundamental energy is to value creation.
It is one of the few variables that simultaneously affects profitability, sustainability, and enterprise value; yet it is still treated as an operational line item.

The reality: the way enterprises manage, optimize, and interpret energy data can define their future competitiveness.

The Value Chain Multiplier

Energy impacts every dimension of enterprise performance across cost, carbon, and competitiveness.

Cost Driver:

25–40% of total manufacturing cost is energy-linked in energy-intensive sectors.
KPMG’s global manufacturing cost competitiveness study clearly identifies utility and energy cost as a primary cost driver influencing margin strength, competitiveness, and location strategy.

Carbon Driver:

Energy sources define emission intensity and ESG ratings, influencing brand and investor perception.

Continuity Driver:

Energy reliability safeguards uptime, delivery commitments, and customer trust.

Together, these drivers determine not only operational success but also how investors value long-term resilience and performance.

The Problem: Energy Still Treated as Expense, Not Asset

Most organizations measure how much energy they consume, not how effectively they use it.
Traditional dashboards show usage trends but fail to connect energy flow with business performance.
Without understanding how energy drives output, cost, and carbon, enterprises underutilize their most powerful lever for value creation.

The result: billions spent globally on monitoring consumption, but little progress in optimizing the economics behind it.
Energy remains managed by operations and finance when it should be governed as a strategic domain at the board level.

The Transition: From Energy Management to Energy Intelligence

To close this gap, organizations must move beyond consumption tracking to energy intelligence, the ability to link energy performance directly to business outcomes.

Greenovative’s platform enables that shift by transforming energy from a cost center into a strategic performance variable:

  • Links energy flow to output, cost, and carbon metrics, mapping how each unit of energy impacts productivity.
  • Unifies plant-level data into enterprise-wide intelligence, offering real-time visibility across assets, shifts, and sites.
  • Quantifies value by showing how improvements in energy efficiency translate into measurable financial and sustainability outcomes.

This approach turns operational data into boardroom insight, helping leadership see where energy efficiency drives margin, carbon reduction, and resilience simultaneously.

Conclusion

Energy is not just what powers operations, it powers enterprise value.
Companies that treat energy as strategy consistently outperform in cost control, ESG scores, and competitiveness.

For CXOs, the question has evolved: it is no longer “How much energy do we use?” but “How much value do we create from the energy we use?”

Greenovative enables that transformation, equipping enterprises with intelligence that connects energy, productivity, and profitability at scale.

Enterprise AI – From Reports to Results

In many enterprises today, what’s called “AI” is often just dashboards or BI tools with smarter visuals. They tell decision-makers what happened, but rarely why, and almost never prescribe what to do next.

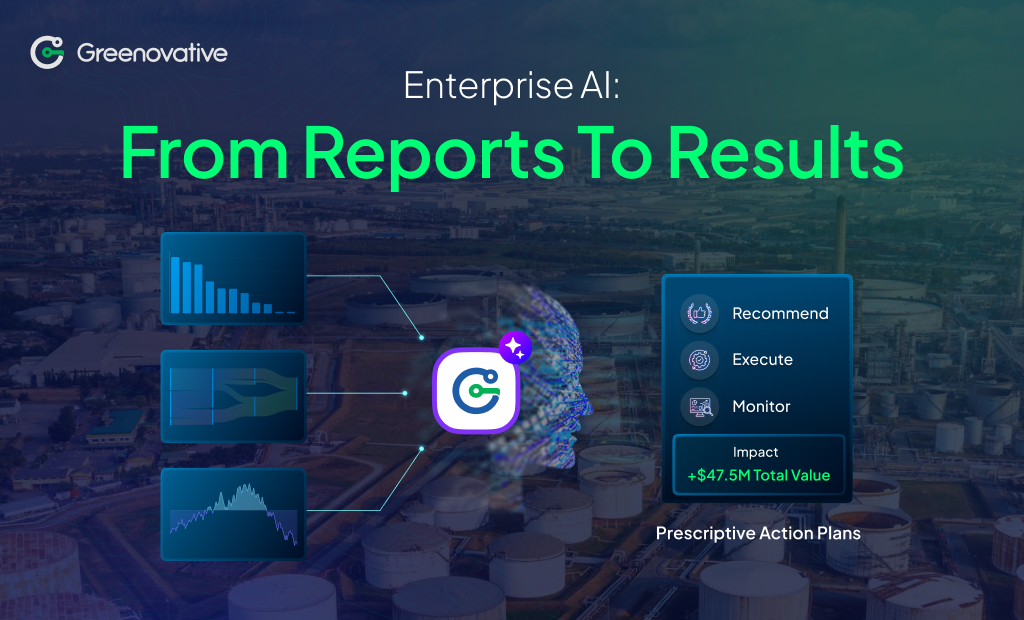
The real leap is from descriptive tools to prescriptive intelligence, an AI that behaves like a strategic advisor, interpreting complexity, recommending high-impact actions, and driving real outcomes.

Why Most “Enterprise AI” Today Is Just Dressed-Up BI

  • Data-rich, insight-poor: According to industry forecasts, the global enterprise AI market is estimated at USD 97.2 billion in 2025, climbing to USD 229.3 billion by 2030 (CAGR ~18.9 %). Yet many adopters remain stuck at dashboards.
  • Descriptive bias: Most systems focus on aggregation, trend-lines, and alerts, showing correlations or past deviations, but not giving causal clarity.
  • Action gap: Even when insights emerge, translating them into executable decisions often remains with human teams, introducing delays, inefficiencies, and guesswork.
  • Siloed intelligence: AI deployments often live within functions (supply chain, maintenance, energy) with little cross-domain decision coordination, limiting strategic coherence.

The gap is clear: dashboards tell, but don’t act. Strategy leaders and CFOs increasingly demand AI that turns data into decisions, not just insights.

What True Enterprise AI Looks Like

The shift is from “reporting AI” to prescriptive, decision-intelligence AI. The key traits:

  1. Interprets Complexity
    Advanced models ingest multiple domain signals (e.g. energy management system, operations, maintenance, market data) simultaneously and decode interdependencies.
  2. Prescribes Clear Actions
    Instead of issuing alerts, the system recommends optimized interventions (e.g. reroute load, change schedule, modulate inputs) with expected metrics (e.g. cost savings, risk reduction).
  3. Simulates & Validates
    It runs “what-if” scenario simulations, quantifies trade-offs, and refines suggestions based on real-world feedback.
  4. Drives Outcomes
    It doesn’t stop at suggestions, monitors execution, verifies results, and adapts continuously.
  5. Acts as Strategic Advisor
    It elevates from an operational tool to a partner in planning: linking decisions to P&L, carbon, risk, and competitive positioning.

One research direction, for example, is PresAIse, a prescriptive AI framework enabling users to interact via natural language, interpret causal inference, and suggest decisions in enterprise contexts.

From Insight to Impact

Consider a manufacturing company that observed repeated supply-chain disruptions. Their “AI” dashboard flagged frequent delays and rising costs, but didn’t propose why or how to fix them.

A real enterprise AI system delved deeper:

  • Mapped order-to-fulfilment times against machine downtime, raw material variances, and logistics patterns.
  • Prescribed an action: shift loading of specific SKUs to alternate lines during weather-forecasted delays.
  • Simulated the projected gain: a 4 % cost reduction and 8 % improvement in on-time delivery.

This is not magic, it’s AI as strategic advisor, turning raw data into executed decisions.

Key Benefits for Strategy & Finance

  • Higher ROI on data assets: You stop investing in dashboards and begin capturing value from them.
  • Shorter decision cycles: From insight to action in hours, not weeks.
  • Risk reduction: Because decisions come with built-in simulations and validation.
  • Scalable decision capacity: Human leaders remain in control, but AI supports high-velocity, multi-parameter trade-offs.
  • Competitive differentiation: Companies that operationalize AI beyond reporting can outperform peers by 5–15 % on margins, agility, and innovation.

Adopting Enterprise AI: Key Considerations

  • Data infrastructure maturity: You need solid pipelines, clean models, and cross-domain integration.
  • Model transparency & interpretability: Business users must understand why the system makes certain suggestions.
  • Responsible AI governance: Decisions must be auditable, traceable, and aligned with regulatory/ethical frameworks.
  • Continuous feedback loop: The system must learn from outcomes to refine prescriptions.

According to Wikipedia’s definition of prescriptive analytics, this stage of analytics “suggests decision options… and shows implications of each decision option,” advancing significantly beyond descriptive and predictive models.

From Reports to Impact

Enterprises that lean on dashboards alone are operating at a plateau. The true frontier of AI lies in prescriptive, decision-intelligence systems, where AI is not a passive tool but an active advisor.

Moving from insight to impact means:

  • recognizing that AI must prescribe, not only report;
  • integrating cross-domain signals;
  • validating recommended actions;
  • and closing the loop on execution and outcomes.

If your current AI feels more like visualization than transformation, it’s time to reframe: AI should not just show you what’s happening, but tell you what to do next, predict what will happen, and ensure the results follow.